Guide to STAR Measures

STAR Measures, which govern quality performance for more than 33 million Medicare Advantage beneficiaries, are a defining driver of financial sustainability, quality improvement, and competitive positioning in value-based care. They are CMS’s comprehensive quality rating system that evaluates Medicare Advantage and Part D plans across clinical outcomes, patient experience, access, and operational performance.

STAR Measures Overview

AAVBC’s STAR Measures Overview provides a concise, evidence-informed framework to help organizations understand CMS requirements, improve quality scores, and strengthen performance across value-based programs.
Learn more

STAR Measures in Value-Based Care: A Framework for Quality Assessment and Performance Optimization

The Medicare Part C (Medicare Advantage [MA]) and Part D (MA-PD) STAR Measures program represents the cornerstone of value-based care quality assessment in the Medicare system, directly impacting over 33 million beneficiaries and billions of dollars in quality bonus payments.

Approximately 42% of MA-PDs (229 contracts) that were offered in 2024 earned 4 stars or higher for their 2024 overall rating. Weighted by enrollment, approximately 75% of MA-PD enrollees in contracts had 4 or more stars in 2024.¹ The STAR rating system evaluates Medicare Part C Organizations (Medicare Advantage Organizations [MAOs]) and Prescription Drug Plans (PDPs) across up to 40 distinct quality and performance measures¹, creating a comprehensive framework for measuring healthcare delivery effectiveness.

Key Financial Impact Findings

  • Federal spending on Medicare Advantage bonus payments declined by $1 billion (8%) to $11.8 billion in 2024, following the expiration of pandemic-era policies that temporarily increased STAR Ratings for some plans.³
  • Most Medicare Advantage enrollees (72%) were in plans that received bonus payments in 2024.³
  • The average bonus payment per enrollee is highest for employer and union-sponsored Medicare Advantage plans ($456) and lowest for special needs plans ($330).10
  • More than 92% of members were in a 3.5-star MA-PD plan or better in 2024. That figure decreased slightly for 2025 to 89.84%.⁶

2025 Quality Bonus Payment Structure

The 2025 bonus payment framework establishes tiered rebate percentages based on STAR performance:

  • 4.5 and 5 Star Plans: Receive a 70% rebate percentage, representing the highest quality bonus tier.
  • 3.5 and 4 Star Plans: Receive a 65% rebate percentage.
  • 4 Star Plans: Additionally receive a 5% increase in their benchmark as a quality bonus payment.
  • Plans Below 3.5 Stars: Do not qualify for quality bonus payments.
  • 5 Star Plans: While sharing the same rebate percentage as 4.5-star plans, gain significant competitive advantage through year-round marketing capabilities beyond standard enrollment periods.

The STAR system's evolution reflects CMS's commitment to driving quality improvement while managing program costs. The average plan STAR Rating will decrease from 4.07 to 3.92 in 2025, demonstrating the system's design to continuously raise performance expectations.⁶ Healthcare executives must understand that STAR performance directly correlates with financial sustainability, market competitiveness, and regulatory compliance in an increasingly value-driven healthcare environment.

Introduction to STAR Measures

Historical Context and Development

The Medicare Advantage and Part D STAR Rating system emerged from the Medicare Modernization Act of 2003 and the Affordable Care Act of 2010, establishing the first comprehensive quality measurement framework for Medicare managed care. The program was designed to address three fundamental challenges: lack of standardized quality metrics across plans, insufficient transparency for beneficiary decision-making, and misaligned financial incentives that rewarded enrollment over outcomes.

Since its inception in 2012 for quality bonus payments3,11, the STAR system has evolved from a basic performance measurement tool to a sophisticated value-based care framework. After increasing by more than 400% between 2015 and 2023, federal spending on Medicare Advantage bonus payments demonstrates the program's significant growth and financial impact on the healthcare system.³
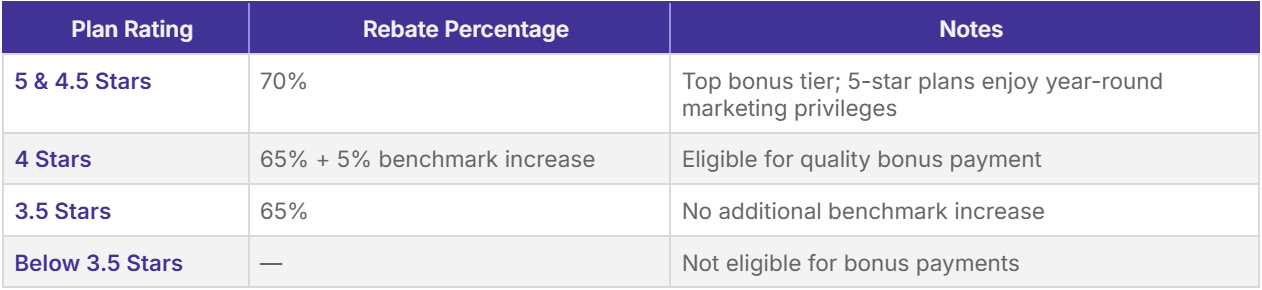
The 5-STAR Rating System Explained

The STAR rating system employs a 5-point scale where higher ratings indicate superior performance:

  • 5 Stars: Excellent performance, eligible for quality bonus payments and public recognition with high-performing icons¹. Five-star plans also provide beneficiaries with a Special Enrollment Period (SEP) for year-round enrollment (December 8th - November 30th), allowing Medicare beneficiaries to switch to these high-quality plans once per year outside of standard enrollment periods.
  • 4.5-4 Stars: Above-average performance, eligible for quality bonus payments.
  • 3.5 Stars: Average performance, baseline rating with no bonus eligibility.
  • 3 Stars or Below: Below-average performance, potential regulatory scrutiny (including termination from participation in Medicare Advantage).
  • Consistently Low Performers: Plans receiving low-performing icons for sustained poor quality.¹

Regulatory Consequences for Poor Performance

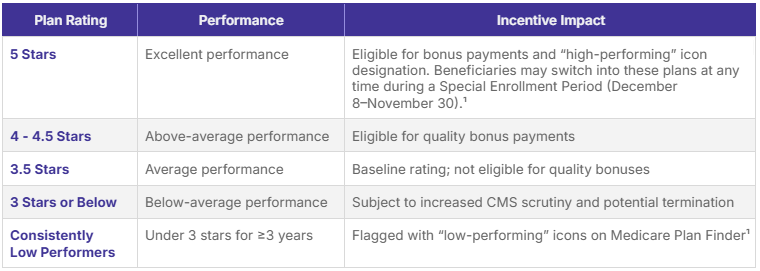
The Centers for Medicare and Medicaid Services (CMS) may terminate a Medicare Advantage plan that fails to achieve a three-star rating or higher for three consecutive years. Plans consistently scoring below three stars for three years in a row face potential contract non-renewal from CMS. Additionally, CMS issues "consistent poor performer" notices to beneficiaries enrolled in plans with ratings below three stars for three or more years, encouraging them to consider enrolling in higher-quality plans during the Open Enrollment period. This regulatory framework ensures that sustained poor performance has meaningful consequences for plan sponsors.

Organizations that are non-profit more frequently earn higher ratings than organizations that are for-profit. For MA-PDs, approximately 56% of non-profit contracts received 4 or more stars compared to 36% of for-profit MA-PDs, highlighting the correlation between organizational structure and quality outcomes.¹

Connection to Value-Based Care Principles

STAR measures align directly with value-based care's core tenets by measuring outcomes rather than volume, emphasizing prevention and care coordination, and linking financial incentives to quality performance. The system creates a comprehensive value equation:

Plan Value = (Quality Outcomes + Patient Experience + Health Equity) ÷ Total Cost of Care

This framework drives healthcare organizations toward population health management, evidence-based care delivery, and patient-centered service models essential for thriving in value-based contracts beyond Medicare Advantage.

STAR Measures Framework and Categories

Health Outcomes Measures (Weight: 3x)

Health outcomes measures carry the highest weight in STAR calculations, reflecting CMS's emphasis on clinical effectiveness and patient health improvement. These measures assess plans' ability to deliver care that meaningfully improves beneficiary health status over time.

Key Health Outcomes Measures:

  • Controlling Blood Pressure: The weight for the Part C Controlling Blood Pressure measure was increased from 1 to 3 for 2024 ratings, emphasizing cardiovascular health management.¹
  • Diabetes Care - Blood Sugar Controlled: Measures glycemic control in diabetic patients.
  • Plan All-Cause Readmissions: The updated Plan All-Cause Readmissions (Part C) measure was re-specified and transitioned off the display page into the 2024 STAR Ratings as a new measure with a weight of 1 for the first year.¹ Based on the provided search results, the Plan All-Cause Readmission (PCR) measure in the Medicare Advantage STAR Ratings program has a weight of 3 for the 2025 STAR Ratings, representing an increase from its previous weight of 1.

Scoring Methodology

Health outcomes measures use clinical thresholds based on evidence-based guidelines. Cut-points are recalculated annually using hierarchical clustering with Tukey outlier deletion to ensure statistical validity and reduce the impact of extreme performers.1,2

Intermediate Outcomes Measures (Weight: 1-3x)

Intermediate outcomes focus on clinical quality indicators that serve as proxies for long-term health improvement, emphasizing preventive care and chronic disease management.

Primary Intermediate Measures:

  • Breast Cancer Screening: Monitors preventive care delivery effectiveness.
  • Colorectal Cancer Screening: Assesses population health management capabilities.
  • Medication Adherence (Diabetes, Hypertension, Cholesterol): Measures care coordination and patient engagement.
  • Annual Flu Vaccine: Indicates preventive care infrastructure strength.

Performance Trends

A growing number of plans scored highly on some measures like breast cancer screenings, while more plans scored lower on other measures like colorectal cancer screenings, demonstrating the dynamic nature of quality performance across different clinical areas.²

Patient Experience Measures (Weight: Transitioning from 4x to 2x)

Patient experience measures, derived from the Consumer Assessment of Healthcare Providers and Systems (CAHPS) surveys, assess beneficiary perceptions of care quality, access, and service delivery. CMS will reduce the weight of CAHPS and administrative measures from 4x to 2x. This change shifts the focus slightly away from patient experience and administrative efficiency, prompting payers to balance their efforts across a broader range of quality measures.⁷

Core CAHPS Domains:

  • Getting Needed Care: Measures access to necessary medical services.
  • Getting Appointments and Care Quickly: Assesses care accessibility and responsiveness.
  • Customer Service: Evaluates plan administrative effectiveness.
  • Rating of Health Care Quality: Captures overall beneficiary satisfaction with care received.
  • Care Coordination: Measures integration and communication across providers.

Survey Administration

CMS requires all MA and PDP plans, 1876 cost contracts, and Part D sponsors with 600 or more enrollees as of July of the previous year to survey a defined sample of their eligible members. Plans must contract with CMS-approved vendors for survey administration to ensure standardization and reliability.16,19

Access Measures (Weight: 2-4x)

Access measures evaluate plans' ability to provide timely, geographically accessible healthcare services to their enrolled populations. These measures focus on structural capabilities rather than clinical outcomes.

Key Access Indicators:

  • Call Center Performance: Foreign language interpreter and TTY availability.
  • Appeals Processing: Timeliness of decision-making and review processes.
  • Provider Network Adequacy: Geographic and specialty access sufficiency.
  • Pharmacy Network Access: Prescription drug availability and convenience.

Process Measures (Weight: 1-3x)

Process measures assess healthcare delivery efficiency and adherence to evidence-based care protocols, serving as leading indicators of quality outcomes.

Critical Process Measures:

  • Medication Reconciliation Post-Discharge: Care transition quality indicator.
  • Care for Older Adults: Comprehensive geriatric assessment protocols.
  • Special Needs Plan Care Management: Specialized population care coordination
  • Transitions of Care: Both the Transitions of Care (Part C) and Follow-Up after Emergency Department Visit for People with Multiple High-Risk Chronic Conditions (Part C) measures. were added to the 2024 STAR Ratings, each with a weight of 1.¹

Quality Metrics and Performance Benchmarking

Cut-Point Methodology and Statistical Analysis

The STAR Rating system employs sophisticated statistical methods to ensure fair and meaningful performance comparisons across diverse plan populations and geographic markets.   The cut points are recalculated each year based on performance during the measurement period. Many of the measure-level cut points increased from the 2024 STAR Ratings, meaning that, overall, contracts had to achieve higher performance on these measures to receive a high STAR Rating.²

Hierarchical Clustering Process:

  1. Data Collection: Performance data aggregated across all eligible contracts.¹
  2. Outlier Detection: As finalized in rulemaking in 2020, the 2024 STAR Ratings introduced Tukey outlier deletion when calculating the cut points for all non-CAHPS measures in order to improve predictability and stability in the STAR Ratings.¹
  3. Mean Resampling: Statistical simulation to determine optimal cut -point placement.¹
  4. Percentile Distribution: Assignment of STAR Ratings based on relative performance.¹

Risk Adjustment Considerations

Measures undergo case-mix adjustment for patient demographics, health status, and social risk factors to ensure equitable comparisons across different patient populations and geographic areas.1,7

Performance Benchmarking Standards

STAR measures utilize relative performance benchmarking, where STAR Ratings are determined by comparing each plan's performance to the distribution of all plan performances nationally. This approach ensures that ratings reflect current industry capabilities while driving continuous improvement.1,2

Benchmark Categories:

  • National Benchmarks: All-plan performance distributions.¹
  • Peer Group Comparisons: Similar plan type and market characteristics.¹
  • Geographic Adjustments: Regional variation considerations.¹
  • Specialty Population Standards: SNP and FIDE-SNP specific benchmarks.¹

Generally, higher overall STAR Ratings are associated with contracts that have more experience in the MA program, indicating that performance benchmarking accounts for organizational maturity and learning effects.¹

Year-over-Year Performance Tracking

The STAR system incorporates multi-year performance tracking to identify trends, ensure rating stability, and prevent manipulation of short-term performance fluctuations.1,2

Temporal Analysis Components:

  • Measurement Period Alignment: 2-3 year data collection cycles for different measure types.¹
  • Performance Trajectory Analysis: Trend identification and sustainability assessment.¹
  • Guardrails Application: Bi-directional guardrails are now applied, as needed, starting with the 2025 STAR Ratings to this measure after mean resampling if cut points change by more than 5%.²

Historical Performance Context

Plans scored a 4.37 on average in 2022, compared to current lower averages, demonstrating the system's evolution toward higher performance standards and the impact of pandemic-era adjustments normalizing.⁶

Financial Impact and Incentive Structure

Quality Bonus Payment Calculations

The Quality Bonus Payment (QBP) system represents one of the largest value-based payment programs in healthcare, with substantial financial implications for Medicare Advantage organizations. The total spending on the quality bonus program is less than 3% of the projected payments to Medicare Advantage plans in 2024 ($462 billion), yet these payments significantly impact plan profitability and competitive positioning.⁵

QBP Calculation Framework

  • 4+ Star Plans: Receive 5% benchmark increase in high-performing counties.¹¹
  • Double Bonus Counties: Eligible for up to 10% benchmark increases.¹¹
  • Rebate Enhancement: Higher STAR Ratings enable greater rebate percentages for supplemental benefits.¹¹
  • New Plan Protections: Plans lacking sufficient data receive 3.5% benchmark increases.¹¹

Payment Distribution Analysis

UnitedHealthcare receiving the largest total payments ($3.4 billion), and Kaiser Permanente receiving the highest per-member payments, demonstrate how plan size and performance combine to determine total QBP revenue.³

Market Share and Competitive Advantages

STAR Ratings directly influence beneficiary enrollment decisions and plan market competitiveness beyond direct bonus payments. High-performing plans leverage their ratings for marketing advantages and enhanced benefit offerings.3,19

Competitive Impact Factors

  • Public Reporting: Medicare Plan Finder prominently displays STAR Ratings for consumer comparison.¹⁹
  • Enhanced Benefits: Because higher-rated plans receive higher rebates, those plans can offer enhanced benefits, which further increase the attractiveness of those plans relative to plans with lower quality ratings.¹¹
  • Brand Recognition: A total of 36 contracts are highlighted on the Medicare Plan Finder with a high performing icon indicating they earned 5 stars.¹

Enrollment Correlation

Medicare spending on bonus payments has grown faster than enrollment in Medicare Advantage, which doubled between 2015 and 2024 (rising from 16 million people to 33 million people), indicating that quality performance attracts disproportionate enrollment growth.³

Cost of Poor Performance

Low STAR Ratings carry significant financial and regulatory consequences beyond lost bonus payments, including market share erosion, regulatory scrutiny, and increased operational costs.1,8

Financial Penalties for Poor Performance:

  • Lost Bonus Revenue: Potential forfeiture of millions in QBP funding.³
  • Reduced Rebate Capacity: Lower supplemental benefit offerings.¹¹
  • Marketing Restrictions: CMS can limit enrollment for consistently poor performers.¹
  • Regulatory Oversight: There are six contracts identified on the Medicare Plan Finder with a low performing icon for 2024 for consistently low quality ratings.¹

Long-term Financial Impact

This year's total payouts are a 400+% jump from bonuses back in 2015, when plans got $3 billion total, demonstrating the escalating financial stakes of STAR performance in the Medicare Advantage market.⁹

Revenue Impact Analysis with Concrete Examples

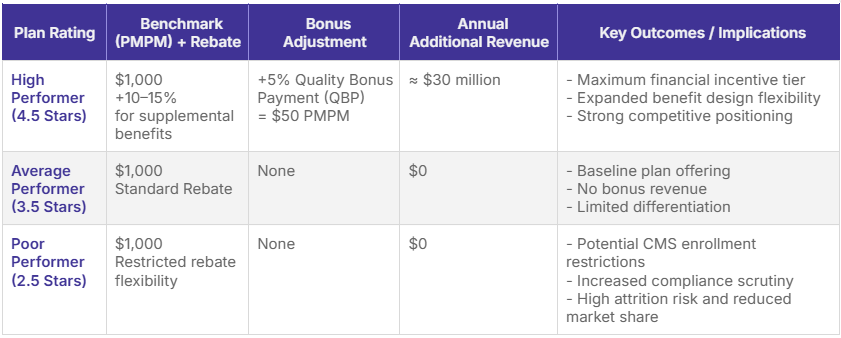
To illustrate the real-world financial implications, consider a hypothetical 50,000-member Medicare Advantage plan:3,11

High Performer (4.5 Stars)

Base benchmark: $1,000 PMPM¹¹
5% QBP increase: $50 PMPM¹¹
Annual additional revenue: $30 million³
Enhanced rebate capacity: Additional 10-15% for supplemental benefits¹¹

Average Performer (3.5 Stars)

Base benchmark: $1,000 PMPM¹¹
No QBP bonus: $0 additional revenue¹¹
Limited rebate capacity: Standard benefit offerings only¹¹

Poor Performer (2.5 Stars)

Base benchmark: $1,000 PMPM¹¹
Potential enrollment restrictions and regulatory costs¹
Lost competitive positioning and member attrition risk³

Implementation Strategies for Healthcare Organizations

Clinical Workflow Integration

Successful STAR performance requires systematic integration of quality measures into clinical workflows, ensuring that care delivery processes naturally generate high-quality outcomes and data capture.23,24

Workflow Design Principles

  • Point-of-Care Alerts: EHR-integrated reminders for preventive care and quality measures.²³
  • Care Gap Identification: Automated systems to identify and prioritize intervention opportunities.²³
  • Performance Dashboards: Real-time visibility into measure performance for clinical teams.²³
  • Standardized Protocols: Evidence-based care pathways aligned with STAR measure specifications.²³

Clinical Integration Strategy

Organizations must embed STAR measure requirements into routine care delivery rather than treating them as separate quality initiatives. This includes provider education, workflow redesign, and performance feedback systems.23,24

Data Collection and Reporting Systems

Robust data infrastructure forms the foundation of successful STAR performance, requiring sophisticated systems for data capture, validation, and reporting across multiple domains.1,23

Technology Infrastructure Requirements

  • Electronic Health Records: Comprehensive documentation supporting measure calculations.1,23
  • Claims Data Integration: Administrative data linkage for outcome measurement.¹
  • Survey Administration: CAHPS and HOS survey management capabilities.16,19
  • Analytics Platforms: Performance monitoring and predictive analytics tools.²³

CPT Category II Code Implementation

CPT II codes serve as a critical component of streamlined data collection, enabling real-time performance tracking through claims submission rather than manual chart reviews. These alphanumeric codes significantly reduce administrative burden by automating HEDIS measure reporting, ensuring accurate documentation of clinical activities such as HbA1c levels, blood pressure readings, and preventive care services. Implementation of CPT II coding protocols facilitates proactive care gap identification and supports targeted interventions for quality improvement initiatives.

Data Refresh Frequency and Real-Time Monitoring

The increased frequency of data refreshes in Medicare Advantage plans necessitates robust continuous monitoring systems rather than annual evaluation cycles. Organizations must establish comprehensive gap monitoring protocols that enable proactive identification and remediation of performance issues throughout the measurement year. This shift from reactive to proactive data management requires enhanced analytics capabilities for real-time performance tracking and immediate intervention deployment when quality metrics decline.

Data Quality Assurance

Data integrity issues are now included in the description of missing data in the extreme and uncontrollable circumstance (disaster) policy, emphasizing the critical importance of data accuracy and completeness in STAR Ratings.¹ Enhanced data validation processes must accommodate more frequent refresh cycles while maintaining accuracy standards for measure calculations and outcome reporting.

Staff Training and Engagement Protocols

Healthcare organizations must develop comprehensive training programs to ensure all staff understand their role in STAR performance and quality improvement initiatives.23,24

Training Framework Components

  • Leadership Engagement: Executive sponsorship and accountability for STAR performance.²³
  • Clinical Education: Provider training on measure specifications and clinical best practices.²³
  • Support Staff Training: Administrative and ancillary staff education on quality processes.²³
  • Performance Feedback: Regular communication of results and improvement opportunities.²³

Engagement Strategies

Successful organizations create culture change that aligns individual performance with organizational STAR objectives through incentive alignment, recognition programs, and shared accountability.23,24

Provider-Level STAR Performance Strategies

Individual providers can implement targeted strategies to directly impact STAR Ratings through enhanced clinical practices and patient engagement approaches. These comprehensive strategies focus on four core areas that drive measurable improvements in Medicare Advantage STAR Ratings performance.

Enhanced Member Engagement and Relationship Building

Providers should prioritize building strong therapeutic relationships through personalized outreach, educational resources, and clear communication channels that foster trust and encourage active participation in care. This includes establishing regular touchpoints with patients beyond scheduled visits, utilizing patient-preferred communication methods, and providing culturally competent care that addresses individual needs and preferences. Digital tools should be leveraged to streamline communication, provide convenient access to care information, and enable real-time patient monitoring.

Providers must also address social determinants of health by recognizing and responding to social factors that impact health outcomes, such as access to food, housing, and transportation. Additionally, promoting health equity through focused efforts on improving outcomes for underserved populations can positively impact overall STAR Ratings while advancing population health goals.

Comprehensive Chronic Condition Management

Effective chronic disease management requires implementing systematic approaches that include comprehensive care management programs, Remote Patient Monitoring initiatives, and Chronic Care Management protocols that provide ongoing support for members with complex conditions. Providers should develop personalized care plans tailored to individual patient needs, preferences, and health literacy levels, ensuring members receive the right care at the right time through coordinated, evidence-based interventions.

Medication adherence strategies are critical, including systematic medication reconciliation processes, adherence counseling, regular medication therapy management reviews, and implementation of tools and systems that help patients manage their medications effectively to reduce complications and hospitalizations.

Proactive monitoring protocols should be established for high-risk patients, with regular assessments and timely interventions to prevent disease progression and acute episodes.

Preventive Care Prioritization and Care Gap Closure

Providers must systematically encourage annual wellness visits and promote preventative screenings, vaccinations, and other recommended services to identify potential health issues early and maintain optimal health status. This requires implementing robust care gap identification and closure processes that systematically address missed or delayed screenings, treatments, and preventive services to ensure members receive necessary care according to evidence-based guidelines.

Data analytics should be utilized to identify high-risk individuals and proactively reach out to members who may be at higher risk for certain conditions or complications, enabling targeted interventions that improve outcomes and prevent costly complications.

Data-Driven Quality Improvement and Clinical Decision Support

Providers should implement comprehensive data collection and integration systems that create a unified view of member health across all care settings and touchpoints. This includes utilizing advanced data analytics to identify trends, predict risks, and personalize interventions that improve patient outcomes while supporting STAR measure performance. Evidence-based clinical decision support tools should be integrated into workflow processes to guide clinical decision-making and ensure adherence to best practices.

Quality assurance processes must be established to continuously monitor and improve the quality of care delivered, with regular performance reviews and improvement initiatives targeting specific STAR measures relevant to the patient population.

Operational Excellence and Care Coordination

Key provider strategies include establishing standardized workflows for STAR-specific measures, utilizing patient registries for systematic tracking and outreach, and maintaining robust documentation practices that capture all relevant clinical activities and outcomes.

Providers should participate in collaborative care models that enhance coordination across the care continuum, implement shared decision-making processes with patients to improve engagement and adherence, and engage in continuous quality improvement activities that target specific STAR measures. Comprehensive care coordination for high-risk patients should include regular team-based reviews, structured communication protocols, and seamless transitions between care settings to ensure continuity and prevent gaps in care delivery.

STAR measure success requires coordinated effort across multiple departments and functions, necessitating formal governance structures and communication protocols that align all stakeholders around common quality and performance goals.²³

Cross-Functional Team Coordination

STAR measure success requires coordinated effort across multiple departments and functions, necessitating formal governance structures and communication protocols.

Team Structure Requirements:

  • Quality Committee: Senior leadership oversight and strategic direction.²³
  • Clinical Quality Teams: Physician and nursing leadership for clinical measures.²³
  • Member Experience Teams: CAHPS and patient satisfaction management.
  • Analytics Teams: Data analysis and performance monitoring.²³
  • Operations Teams: Workflow implementation and process improvement.²³

Coordination Mechanisms

Regular interdisciplinary meetings, shared performance metrics, and integrated improvement initiatives ensure alignment across all functional areas impacting STAR performance.²³

Case Studies and Real-World Examples

Case Study 1: High-Performing 5-Star Medicare Advantage Plan

Organization Profile

A regional Medicare Advantage plan serving 150,000 members achieved 5-star status through systematic quality improvement initiatives and strategic focus on patient experience.²³

Performance Results

31 are MA-PD contracts earned 5-star Ratings in 2024, representing exceptional performance across multiple quality domains.¹

Key Success Strategies

  • Population Health Management: Comprehensive risk stratification and care management programs.23,25
  • Provider Partnership: Collaborative relationships with network physicians including shared savings arrangements.²³
  • Technology Investment: Advanced analytics and care coordination platforms.²³
  • Member Engagement: Proactive outreach and personalized communication strategies.16,19

Financial Outcomes

  • $50 PMPM quality bonus payment increase.¹¹
  • $7.5 million annual additional revenue.³
  • 15% year-over-year enrollment growth.³
  • Enhanced market competitiveness.³

Lessons Learned

Success required multi-year sustained investment, organizational culture change, and alignment of financial incentives across all stakeholders.23,24

Case Study 2: Comprehensive Care for Joint Replacement (CJR) Integration

Background

A health system-sponsored Medicare Advantage plan integrated STAR measure improvement with bundled payment program participation to create synergistic quality outcomes.23,24

Integration Approach

  • Aligned clinical protocols across fee-for-service and Medicare Advantage populations.²³
  • Shared care coordination resources and outcomes measurement.²³
  • Integrated performance reporting and improvement initiatives.²³

Demonstrated Results

Surgeons in CJR hospitals were significantly more likely to report hospital programs focused on improving post-discharge care (83% versus 47%), indicating successful care coordination improvement.⁴

STAR Measure Impact:

  • Improved Plan All-Cause Readmissions performance.¹
  • Enhanced Care Coordination CAHPS scores.19
  • Better Transitions of Care measure results.¹
  • Reduced overall cost per member per month.³

Scalability Factors

The approach demonstrated how value-based care initiatives can create positive reinforcement loops across different payment models and population types.23,24

Case Study 3: Special Needs Plan (SNP) Quality Improvement

Organization Challenge

The average bonus payment per enrollee is highest for employer- and union-sponsored Medicare Advantage plans ($456) and lowest for special needs plans ($330), raising questions about the implications of the quality bonus program for equity.10

Improvement Initiative

A Dual Eligible Special Needs Plan (D-SNP) implemented targeted interventions to address health equity disparities and improve STAR performance for vulnerable populations.7,10

Intervention Strategies

  • Social determinants of health screening and intervention.⁷
  • Community health worker integration.²³
  • Transportation and housing assistance programs.⁷
  • Culturally competent care delivery models.⁷

Performance Outcomes

  • 20% improvement in medication adherence measures.¹
  • 15% increase in preventive care completion rates.¹
  • Enhanced CAHPS scores for care coordination and access.19
  • Reduced emergency department utilization.²³

Policy Implications

The case study demonstrates the need for risk adjustment and targeted support for plans serving high-risk populations while maintaining quality improvement incentives.7,10

Quality Improvement Methodologies

Plan-Do-Study-Act (PDSA) Cycles for STAR Measures

Healthcare organizations successful in STAR improvement implement systematic quality improvement methodologies that enable rapid testing and scaling of effective interventions.23,24

PDSA Framework Application

Plan: Identify specific STAR measure performance gaps and design targeted interventions.²³
Do: Implement small-scale pilots with defined populations and timeframes.²³
Study: Analyze performance data and assess intervention effectiveness.²³
Act: Scale successful interventions or modify based on learning.²³

Example PDSA Cycle - Breast Cancer Screening Improvement

  1. Plan: Implement EHR-based screening reminders for women aged 50-74.²³
  2. Do: Deploy alerts for 500 eligible members over 3 months.²³
  3. Study: Analyze screening completion rates and provider satisfaction.²³
  4. Act: Expand successful reminder system across entire eligible population.²³

Lean Six Sigma Applications

Lean Six Sigma methodologies provide structured approaches to eliminating waste and reducing variation in processes critical to STAR measure performance.²³

Define, Measure, Analyze, Improve, Control (DMAIC) Process

  • Define: Specify STAR measure improvement objectives and scope.²³
  • Measure: Establish baseline performance and identify process capabilities.²³
  • Analyze: Determine root causes of performance gaps and variation.²³
  • Improve: Implement solutions and optimize process design.²³
  • Control: Sustain improvements through monitoring and standardization.²³

Application Areas

  • Medication adherence process optimization.¹
  • Care transition protocol standardization.¹
  • Patient experience service recovery procedures.¹⁹
  • Preventive care delivery workflow improvement.¹
  • Implement solutions and optimize process design
  • Control: Sustain improvements through monitoring and standardization.

Population Health Management Strategies

Effective STAR performance requires sophisticated population health management capabilities that identify, stratify, and intervene with members across the risk spectrum.

Risk Stratification Framework

  • High-Risk Members: Intensive care management and frequent monitoring.
  • Rising-Risk Members: Early intervention and prevention programs.
  • Stable Members: Maintenance care and engagement initiatives.
  • Healthy Members: Prevention and wellness program participation.

Intervention Targeting

By analyzing multiple data sources, predictive models can be used to target specific member populations, increase engagement, and improve overall health outcomes.¹⁵

Population Health Technologies

  • Predictive analytics for risk identification.
  • Care management platforms for coordination.
  • Patient engagement tools for activation.
  • Outcome measurement systems for evaluation.

Predictive Analytics and Risk Stratification

Advanced analytics capabilities enable proactive identification of members at risk for poor outcomes and targeted intervention deployment to prevent adverse events.

Predictive Model Applications

  • Readmission Risk: Identify members likely to require hospital readmission.
  • Medication Non-Adherence: Predict adherence challenges before they occur.
  • Care Gap Development: Anticipate preventive care needs and scheduling.
  • Experience Dissatisfaction: Proactively address potential service issues.

Data Sources Integration

  • Claims and administrative data.
  • Clinical data from EHRs.
  • Social determinants of health information.
  • Patient-reported outcome measures.
  • External data sources (pharmacy, lab, imaging).

Implementation Considerations

Successful predictive analytics programs require data governance, model validation, workflow integration, and continuous performance monitoring to ensure clinical relevance and operational effectiveness.

Regulatory Compliance and Future Directions

CMS Oversight and Audit Requirements

Medicare Advantage organizations must navigate complex regulatory requirements for STAR measure data collection, reporting, and validation to maintain program compliance and avoid penalties.

Audit Framework Components

  • Data Validation Studies: CMS contractors verify measure calculation accuracy through medical record review.
  • Survey Oversight: CAHPS and HOS administration monitoring for protocol compliance.
  • Performance Monitoring: Unusual performance pattern investigation and validation.
  • Corrective Action Requirements: Mandatory improvement plans for consistently poor performers

Compliance Obligations

Organizations must maintain detailed documentation supporting all STAR measure submissions, implement approved survey vendor contracts, and respond to CMS information requests within specified timeframes.

Upcoming Changes to STAR Measures

The STAR program continues evolving to address emerging healthcare priorities, technological advances, and policy objectives, requiring organizations to anticipate and prepare for future requirements.

2026-2027 Changes

CMS is introducing five new measures across several domains, reflecting its desire to address critical areas of patient safety, mental and physical health.⁷

New Measure Additions

  • Concurrent Use of Opioids and Benzodiazepines (COB): Patient safety focusing on dangerous drug combinations.
  • Health Outcomes Survey Integration: Starting with the 2026 STAR Ratings, two key HOS measures—"improving or maintaining physical health" and "improving or maintaining mental health"—will be fully integrated back into the STARs program.¹⁵
  • Health Equity Index: Both MY 2024 and MY 2025 performance data will be used in calculating the Health Equity Index ("HEI") reward applied to SY 2027.⁷

Methodological Updates

CMS will reduce the weight of CAHPS and administrative measures from 4x to 2x. This change shifts the focus slightly away from patient experience and administrative efficiency, prompting payers to balance their efforts across a broader range of quality measures.

Integration with Other Quality Programs

STAR measures increasingly align with other CMS quality initiatives, creating opportunities for synergistic improvement efforts and coordinated compliance strategies.

Program Integration Opportunities

  • Merit-based Incentive Payment System (MIPS): Shared quality measures and improvement initiatives with network providers.
  • Bundled Payment Programs: Coordinated outcome measurement and care coordination protocols.
  • Accountable Care Organizations: Aligned population health management and quality metrics.
  • Hospital Quality Programs: Integrated care transition and outcome measurement.

Strategic Alignment

Organizations can leverage shared infrastructure, data systems, and improvement initiatives across multiple quality programs to maximize efficiency and impact.

Policy Recommendations and Industry Trends

Healthcare policy experts and industry stakeholders have identified key areas for STAR program enhancement and healthcare quality improvement more broadly.

Recommended Policy Enhancements

  1. Enhanced Risk Adjustment: The bonus structure may exacerbate geographic inequities across plans, both because quality bonuses are tied to benchmarks — which vary by county — and because of double-bonus designations.¹¹
  2. Health Equity Focus: Continued development of measures and adjustments addressing social determinants of health.
  3. Technology Integration: Support for artificial intelligence and machine learning applications in quality improvement.
  4. Provider Integration: Stronger alignment between plan and provider quality incentives.

Industry Evolution Trends

  • Movement toward outcome-based rather than process-based measures.
  • Integration of patient-reported outcome measures (PROMs).
  • Emphasis on social determinants of health and health equity.
  • Technology-enabled care delivery and monitoring capabilities.

Conclusion and Key Takeaways

The Medicare Advantage STAR Measures program represents the most comprehensive and financially significant quality measurement system in American healthcare, directly impacting patient care for over 33 million beneficiaries and driving over $11 billion in annual quality-based payments. Healthcare executives must recognize that STAR performance is no longer optional but essential for organizational sustainability and competitive success in the evolving healthcare landscape.

Critical Success Factors for Healthcare Organizations

  1. Strategic Leadership Commitment: Generally, higher overall STAR Ratings are associated with contracts that have more experience in the MA program, indicating that sustained organizational commitment and long-term investment are prerequisites for success. Leadership must view STAR improvement as a strategic imperative requiring multi-year planning and resource allocation.
  2. Comprehensive Quality Infrastructure: Successful organizations invest in integrated systems spanning clinical care delivery, data analytics, patient engagement, and quality measurement. This includes sophisticated EHR capabilities, predictive analytics platforms, care management systems, and patient experience monitoring tools.
  3. Culture of Continuous Improvement: High-performing plans embed quality improvement methodologies into organizational DNA, utilizing PDSA cycles, Lean Six Sigma approaches, and evidence-based practice implementation. The feds said cut points also increased because healthcare is returning to pre-pandemic normalcy and because scores were overall more compressed, emphasizing the need for sustained improvement efforts.
  4. Population Health Management Excellence: STAR success requires sophisticated capabilities for risk stratification, care coordination, and proactive intervention deployment across diverse member populations. Organizations must develop predictive models, care management protocols, and engagement strategies tailored to different risk levels and demographic groups.

Return on Investment Analysis

The financial benefits of STAR improvement extend far beyond quality bonus payments. High-performing plans achieve enhanced market positioning, improved member retention, expanded benefit offering capabilities, and reduced regulatory oversight costs. Bonus payments vary substantially across firms, with UnitedHealthcare receiving the largest total payments ($3.4 billion), demonstrating the scalable financial impact of quality excellence.³

Strategic Recommendations for Healthcare Executives

  1. Develop Integrated Quality Strategy: Align STAR improvement with broader value-based care initiatives, bundled payment programs, and provider partnership strategies to create synergistic benefits across multiple performance frameworks.
  2. Invest in Technology Infrastructure: Deploy advanced analytics, care management platforms, and patient engagement tools that enable proactive identification and intervention with at-risk populations while supporting comprehensive quality measurement.
  3. Foster Cross-Functional Collaboration: Establish governance structures and communication protocols that ensure coordination across clinical, operational, and administrative functions critical to STAR performance.
  4. Prepare for Program Evolution: Anticipate upcoming changes including Health Equity Index implementation, HOS measure integration, and weighting adjustments to ensure organizational readiness for future requirements.
  5. Focus on Health Equity: Address disparities in care delivery and outcomes measurement to prepare for Health Equity Index implementation while improving care for vulnerable populations.

The Medicare Advantage STAR system will continue evolving as healthcare moves toward greater value-based accountability, health equity focus, and outcome-based measurement. Organizations that view STAR measures as integral to their mission rather than regulatory compliance requirements will achieve sustainable competitive advantages while delivering superior care to the Medicare population.

Healthcare leaders must recognize that STAR excellence requires organizational transformation encompassing clinical practice redesign, technology deployment, workforce development, and culture change. The organizations that invest strategically in these capabilities will not only achieve superior STAR Ratings but will be best positioned for success across the broader value-based care landscape.

Bottom Line

STAR measures represent both the present reality and future direction of healthcare quality measurement. Organizations achieving excellence in STAR performance demonstrate the clinical capabilities, operational efficiency, and patient engagement required for success in value-based care across all populations and payment models. The $11.8 billion in quality bonus payments for 2024 represents just the beginning of healthcare's transition toward comprehensive value-based accountability.³

Appendix: Overview of CPT II Codes in STAR Measures

Current Procedural Terminology Category II (CPT II) codes are supplemental tracking codes used primarily to support quality and performance measurement in healthcare, especially within value-based care (VBC) frameworks. Unlike Category I CPT codes, which focus on medical procedures and services, CPT II codes provide additional clinical data for performance evaluation and quality assessment.

Purpose and Utilization

CPT II codes are integral to the Healthcare Effectiveness Data and Information Set (HEDIS) measures, supporting the STAR Rating system managed by the Centers for Medicare & Medicaid Services (CMS). These codes streamline data collection, enhance clinical documentation accuracy, and improve the efficiency of quality reporting by reducing the need for chart reviews and manual data abstraction.

Structure and Examples

CPT II codes consist of five characters — four digits followed by the letter 'F.’ They categorize clinical data related to:

  • Clinical components (e.g., blood pressure management).
  • Patient safety indicators.
  • Patient history and assessment.
  • Preventive care and screenings.

Examples

  • 3074F: Systolic blood pressure less than 130 mm Hg.
  • 3044F: HbA1c level less than 7.0%.
  • 1111F: Medication reconciliation post-discharge.

Impact on Value-Based Care and STAR Ratings

Using CPT II codes helps providers meet quality benchmarks that directly affect STAR Ratings, influencing reimbursement, patient care incentives, and provider rankings. Accurate coding supports compliance with CMS performance measures and facilitates proactive care management, improving patient outcomes and organizational efficiency.

Best Practices

  • Regular training for clinical and coding staff on proper use of CPT II codes.
  • Integration of CPT II codes into electronic health record (EHR) systems.
  • Routine internal audits to ensure coding accuracy and compliance.

References

  1. Centers for Medicare & Medicaid Services. (2023). 2024 Medicare Advantage and Part D STAR Ratings Fact Sheet. CMS. https://www.cms.gov/files/document/101323-fact-sheet-2024-medicare-advantage-and-part-d-ratings.pdf
  2. Centers for Medicare & Medicaid Services. (2024). 2025 Medicare Advantage and Part D STAR Ratings Fact Sheet. CMS. https://www.cms.gov/newsroom/fact-sheets/2025-medicare-advantage-and-part-d-star-ratings
  3. Fuglesten Biniek, J., Freed, M., Damico, A., & Neuman, T. (2024). Medicare Advantage Quality Bonus Payments Will Total at Least $11.8 Billion in 2024. Kaiser Family Foundation. https://www.kff.org/medicare/issue-brief/medicare-advantage-quality-bonus-payments-will-total-at-least-11-8-billion-in-2024/
  4. Wakely Consulting Group. (2024). Medicare Advantage STAR Ratings: 2024 Measurement Year Changes. Wakely. https://www.wakely.com/blog/medicare-advantage-star-ratings-2024-measurement-year-changes/
  5. Centers for Medicare & Medicaid Services. (2024). 2025 Medicare Advantage and Part D Rate Announcement. CMS. https://www.cms.gov/newsroom/fact-sheets/2025-medicare-advantage-and-part-d-rate-announcement
  6. Fierce Healthcare. (2024). Medicare Advantage STAR Ratings dip slightly once again in 2025. https://www.fiercehealthcare.com/payers/medicare-advantage-star-ratings-dip-slightly-once-again-2025
  7. FTI Consulting. (2025). Cracking the Code to 2025 CMS STAR Ratings. https://www.fticonsulting.com/insights/articles/cracking-code-2025-cms-star-ratings
  8. Medicare Rights Center. (2024). Medicare Advantage Pulling in Billions in Dubious Quality Bonuses. https://www.medicarerights.org/medicare-watch/2024/09/19/medicare-advantage-pulling-in-billions-in-dubious-quality-bonuses
  9. Healthcare Brew. (2024). Medicare Advantage quality bonus payments to total at least $11.8 billion in 2024, KFF says. https://www.healthcare-brew.com/stories/2024/09/20/medicare-advantage-quality-bonus-payments
  10. Committee for a Responsible Federal Budget. (2024). Employer Plans in Medicare Advantage: A Flaw in the Quality Bonus System. https://www.crfb.org/papers/employer-plans-medicare-advantage-flaw-quality-bonus-system
  11. Congressional Budget Office. (2018). Reduce Quality Bonus Payments to Medicare Advantage Plans. https://www.cbo.gov/budget-options/2018/54737
  12. Centers for Medicare & Medicaid Services. (2024). Health Outcomes Survey (HOS). https://www.cms.gov/data-research/research/health-outcomes-survey
  13. National Committee for Quality Assurance. (2025). HEDIS Medicare Health Outcomes Survey. https://www.ncqa.org/hedis/measures/hos/
  14. Medicare Health Outcomes Survey. (2024). Survey Results and Methodology. https://www.hosonline.org/
  15. Press Ganey. (2025). Navigating the HOS changes: Key strategies for Medicare Advantage plans in 2026. https://info.pressganey.com/press-ganey-blog-healthcare-experience-insights/health-outcome-surveys-2026
  16. Centers for Medicare & Medicaid Services. (2024). Consumer Assessment of Healthcare Providers & Systems (CAHPS). https://www.cms.gov/data-research/research/consumer-assessment-healthcare-providers-systems
  17. Medicare Advantage and Prescription Drug Plan CAHPS Survey. (2024). Program Overview and Background. https://www.ma-pdpcahps.org/
  18. Press Ganey. (2024). MCAHPS: What changes to expect in 2024. https://info.pressganey.com/press-ganey-blog-healthcare-experience-insights/changes-to-mcahps-2024
  19. Centers for Medicare & Medicaid Services. (2024). Medicare Advantage and Prescription Drug Plan CAHPS (MA and PDP CAHPS). https://www.cms.gov/data-research/research/consumer-assessment-healthcare-providers-systems/medicare-advantage-and-prescription-drug-plan-cahps
  20. Press Ganey. (2024). 5 takeaways from recently proposed changes to the Medicare Advantage program. https://info.pressganey.com/press-ganey-blog-healthcare-experience-insights/5-takeaways-from-recently-proposed-changes-to-the-medicare-advantage-program
  21. National Committee for Quality Assurance. (2024). NCQA's Health Plan Ratings 2024. https://www.ncqa.org/hedis/reports-and-research/ncqas-health-plan-ratings-2024/
  22. Agency for Healthcare Research and Quality. (2025). CAHPS Health Plan Survey. https://www.ahrq.gov/cahps/surveys-guidance/hp/index.html
  23. Ellner, A. L., & Phillips, R. S. (2017). The Coming Primary Care Revolution. Journal of General Internal Medicine, 32(4), 380-386.
  24. Berwick, D. M., Nolan, T. W., & Whittington, J. (2008). The triple aim: care, health, and cost. Health Affairs, 27(3), 759-769.
  25. Porter, M. E. (2010). What is value in health care? New England Journal of Medicine, 363(26), 2477-2481.

STAR Measures Guidelines

Access STAR Measures quick reference and deep-dive PDFs by topic area.

RAS Inhibitor Adherence
Process Measures
All

RAS Inhibitor Adherence

Thank you! Your submission has been received!
Oops! Something went wrong while submitting the form.
This is a success message.
This is an error message.